


Revenue is the lifeblood of any business, yet most mid-market companies in North America operate without clear visibility into how their revenue is actually performing. I have worked with dozens of organizations across manufacturing, retail, hospitality, and professional services sectors. A consistent pattern emerges: executives make strategic decisions based on incomplete information, delayed reporting, and fragmented data sources. This is not a technology problem. It is a visibility problem.
A comprehensive revenue analysis dashboard changes this dynamic completely. By consolidating data from multiple sources and presenting it in real-time, visual formats, your executive team gains the clarity needed to make better decisions faster. Over my career building more than 300 dashboards and analytics platforms, I have seen revenue analysis dashboards deliver measurable impact: faster decision-making, improved financial forecasting, identification of underperforming segments, and ultimately, better profitability.
The Current State: Why Revenue Visibility Fails
Before we discuss solutions, let us understand the problem. Most businesses generate revenue data across multiple systems. Sales orders arrive through CRM platforms. Transactions process through payment gateways. Invoices generate from accounting software. Shipments track through fulfillment systems. Customer data lives in separate databases. Financial reporting happens in spreadsheets and accounting platforms.
Each system captures important pieces of the revenue picture. None captures the complete picture. Financial teams spend days compiling reports from these disparate sources, manually reconciling numbers, and creating spreadsheets that become outdated the moment they are completed. By the time a revenue report reaches executives, the data is already old. Decisions are made on historical information rather than current reality.
I consulted with a multi-location hospitality organization struggling with this exact challenge. Each property tracked revenue in its local point-of-sale system. The corporate office received monthly reports from each location, compiled them into a spreadsheet, and distributed financials weeks after the month ended. By the time leadership understood October’s performance, November was already complete. They could not identify emerging issues, respond to underperforming segments, or capitalize on unexpected opportunities because their data was always behind reality.
The solution was not better spreadsheets or more sophisticated accounting. The solution was a revenue analysis dashboard that integrated point-of-sale data, booking systems, payment processing, and accounting records into a single platform providing real-time visibility. Suddenly, executives could see revenue performance by property, by service type, by time period, and by customer segment. They identified which locations were performing above and below expectations. They understood which service offerings generated the most profit. They could respond to issues within days rather than weeks.
What a Revenue Analysis Dashboard Actually Does
A revenue analysis dashboard consolidates financial data and presents it through visual, interactive interfaces that answer critical business questions instantly. Rather than waiting for accounting to compile reports, executives access real-time dashboards that show:
Total revenue across all business segments and time periods. Revenue trends that reveal growth patterns, seasonal cycles, and anomalies requiring investigation. Revenue broken down by business line, customer segment, geographic region, or product category. Profitability analysis showing not just revenue but expenses and net profit. Comparisons between actual performance and forecasted or budgeted amounts. Key performance indicators that highlight whether your business is trending toward or away from goals.
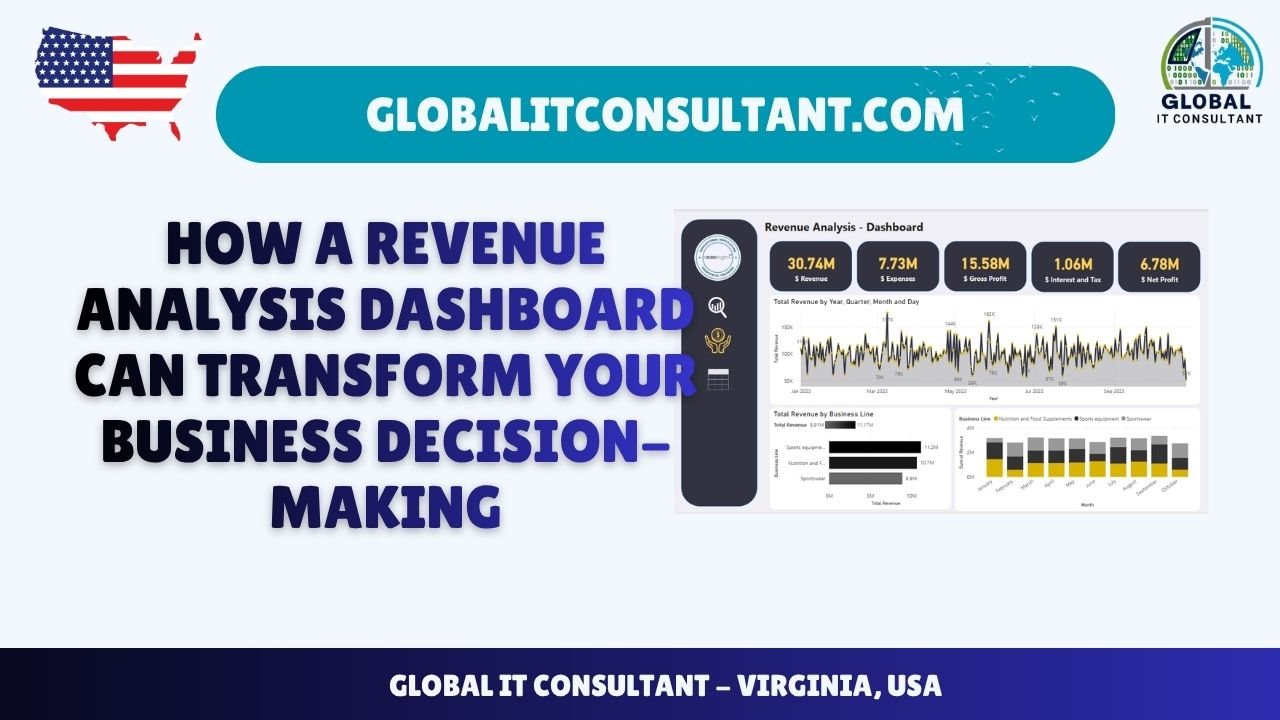
The dashboard I am referencing here shows exactly this type of capability. It displays total revenue of 30.74 million dollars, breaks down expenses and profitability, and shows revenue trends across months. But more importantly, it breaks revenue down by business line, revealing which segments are driving growth and which are underperforming.
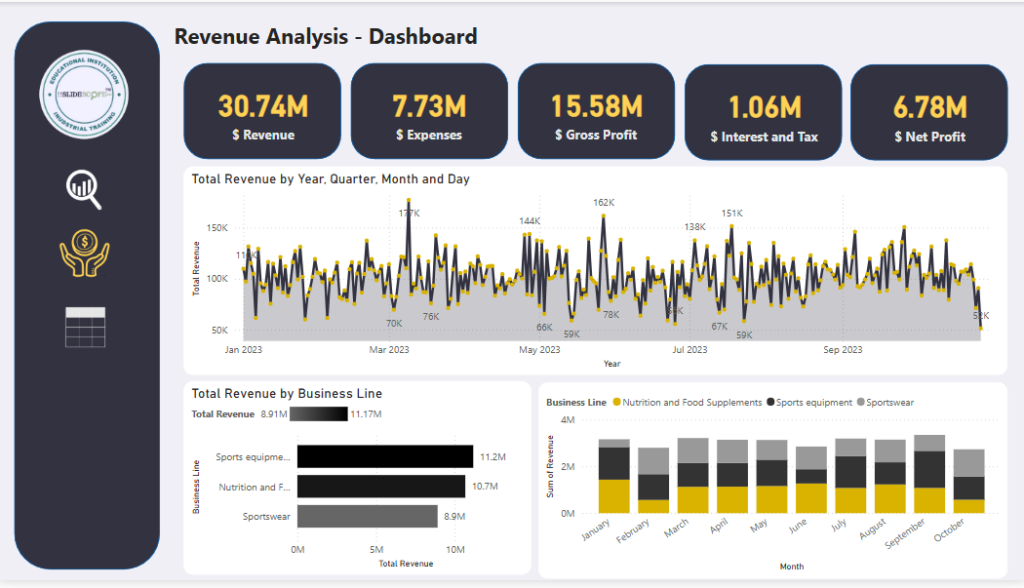
For a mid-market business, this information transforms decision-making. A retail company sees immediately which product categories drive the most revenue. A professional services firm understands which service lines are most profitable. A manufacturing organization identifies which customer segments contribute the most value. A hospitality business sees which properties and service types perform best. This clarity enables strategy.
Data Pipelines: The Engine Behind Revenue Dashboards
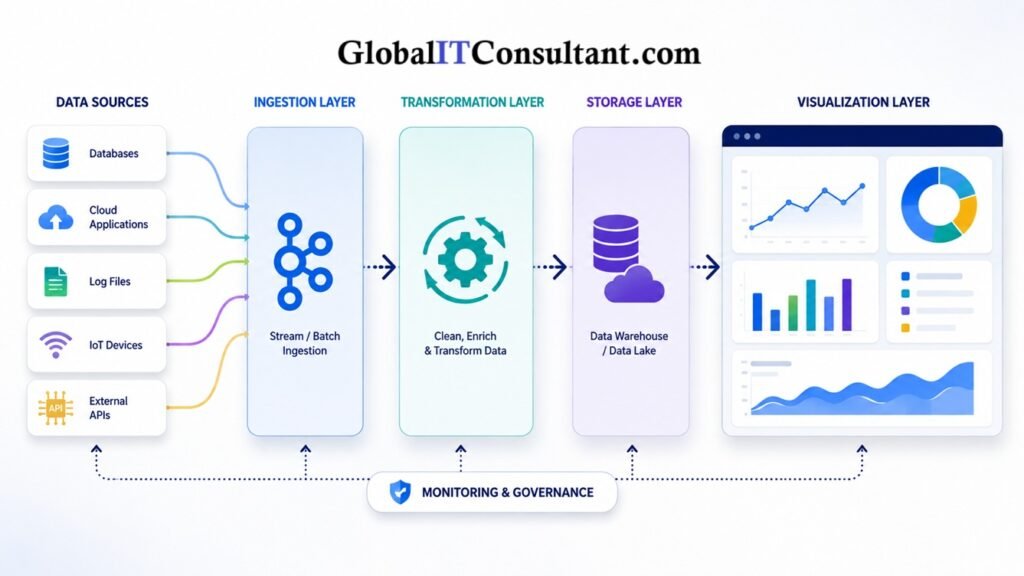
A dashboard is only as good as the data feeding it. This is where data pipelines become critical. A data pipeline is the automated system that extracts data from multiple source systems, transforms it into consistent formats, and loads it into a central repository where dashboards can access it.
Consider a typical revenue dashboard data pipeline. Your sales data originates from a CRM system. Your transaction data comes from payment processing platforms. Accounting data lives in your financial management software. Inventory data tracks in your warehouse management system. Customer data lives in multiple places. These systems use different data formats, different structures, and different definitions of core concepts like revenue.
The pipeline solves this fragmentation. Here is how it works in practice:
First, the extraction phase pulls data from each source system. An automated process connects to your CRM and extracts all sales transactions. Another connection pulls payment data from your payment processor. A third connection retrieves accounting records. This extraction happens on a schedule, perhaps every hour, multiple times per day, or continuously depending on how current your data needs to be.
Second, the transformation phase standardizes this data. If your CRM records revenue as “gross sale” but your accounting system records revenue as “net of discounts,” the transformation layer reconciles these differences. If your CRM uses customer ID 12345 but your accounting system uses customer reference ABC, the transformation layer maps these identifiers. Currency conversions happen here. Time zone adjustments happen here. Data type conversions happen here. By the time data completes transformation, it is consistent and reliable.
Third, the loading phase deposits transformed data into a central data warehouse or database. This central repository becomes the single source of truth for all revenue analysis. Dashboards query this central repository rather than connecting to multiple operational systems.
Let me give you a concrete example. A client I worked with operated a multi-channel retail business. They sold through physical retail locations, an e-commerce website, and a wholesale channel. Each channel captured sales differently. Physical stores used their point-of-sale system. E-commerce captured transactions in their Shopify store. Wholesale orders arrived through a legacy EDI system. Each system was independent.
We built a data pipeline that extracted sales from all three sources nightly. The transformation layer standardized the data: converting all currency to USD, mapping product SKUs to a consistent naming convention, and classifying all revenue by channel and product category. The load phase placed this standardized data into a central database. Now a dashboard could show total revenue across all three channels with perfect accuracy.
Without this pipeline, the company spent two days per week manually compiling revenue reports. With the pipeline, real-time dashboards provided instant visibility. They identified that the e-commerce channel was growing 40 percent month-over-month while retail was flat. This insight drove a strategic shift toward online sales and marketing investment.
Real-World Impact: What Revenue Dashboards Deliver
The business impact of revenue analysis dashboards extends far beyond better reporting. I have measured consistent improvements across multiple dimensions:
Faster decision-making is the most obvious benefit. When executives can see revenue trends in real-time, they respond to issues and opportunities within hours rather than weeks. A healthcare organization I worked with identified a billing system error costing them 15,000 dollars daily within 24 hours thanks to dashboard visibility. Without the dashboard, this error might have persisted undetected for months.
Improved forecasting accuracy comes from trend visibility. When you understand your actual revenue patterns, seasonal variations, and growth trajectories, you forecast more accurately. This improves budgeting, resource planning, and strategic planning.
Identification of underperforming segments enables targeted action. Rather than assuming all business segments perform equally, dashboards reveal which segments, geographies, products, or customers drive value and which drain resources. I worked with a manufacturing company that discovered one customer segment consumed 40 percent of operational resources but generated only 15 percent of revenue. With this insight, they renegotiated terms, reallocated resources, and improved profitability 22 percent.
Cost control improves when businesses understand the relationship between revenue and expenses. A dashboard showing revenue by product line and expenses by product line reveals which products are actually profitable. I consulted with a software services company that believed their enterprise product line was their most profitable. The dashboard revealed their mid-market product line had superior margins. This insight shifted their sales strategy and improved overall profitability.
Better customer understanding emerges when you analyze revenue by customer segment. Which customers are most valuable? Which customer segments have the highest retention? Which segments have the highest growth potential? These questions drive customer strategy and marketing investment.
Building Your Revenue Analysis Dashboard: Where Experts Help
Building an effective revenue analysis dashboard requires more than installing software. It requires understanding your business, identifying data sources, designing the pipeline architecture, ensuring data quality, and creating visualizations that answer your specific strategic questions.
This is where specialists make the difference. At GlobalITConsultant.com, we bring expertise in all these dimensions. We start by understanding your business model, revenue streams, and strategic priorities. We map your existing data sources and assess data quality. We design a data pipeline architecture that extracts from your specific systems, transforms your unique data, and loads it into a platform optimized for your analytics needs.
We select the right tools for your environment. Power BI for organizations already invested in Microsoft infrastructure. Tableau for organizations requiring advanced visualization capabilities. Python-based solutions for custom analytics needs. Google Looker Studio for cost-effective business intelligence. The right choice depends on your technical environment, budget, team skills, and specific requirements.
We handle the technical complexity. Most organizations cannot build robust data pipelines without specialized expertise. We have built data pipelines for dozens of organizations across different industries, different revenue models, and different technical infrastructures. We understand common mistakes, best practices, and how to avoid costly errors.
We ensure data accuracy and reliability. A dashboard is only valuable if the data is trustworthy. We implement data validation, quality checks, and reconciliation processes that ensure your dashboard reflects accurate reality.
We design dashboards that actually answer your questions. Many dashboards display data but do not answer strategic questions. We design dashboards that are specific to your business, focused on your key decision points, and structured to drive action.
Taking the Next Step
Revenue analysis dashboards represent a straightforward investment in better business decision-making. The cost is modest compared to other business technology investments. The payback is typically measured in months, not years. The impact compounds over time as your organization learns to make faster, better-informed decisions.
If your business currently lacks clear visibility into revenue performance, if you are making financial decisions based on incomplete information, or if you spend excessive time compiling revenue reports, a revenue analysis dashboard should be your priority.
Contact GlobalITConsultant.com to discuss your specific needs. We will assess your data sources, understand your strategic priorities, and propose a dashboard solution designed specifically for your business. The businesses that act fastest to gain revenue visibility will outcompete those that remain dependent on outdated reports and incomplete information.
Your revenue data is already being generated. The question is whether you are seeing it in real-time or only after it becomes history.
