


By Ankit Srivastava, Lead Data Analytics Consultant
⚠️ Important Disclaimer
This HR Analytics Dashboard demonstration is built on a publicly available dataset sourced from platforms such as Kaggle. The dashboard is created for educational, tutorial, and consulting demonstration purposes only. No real client data, proprietary business information, or confidential employee records are displayed or used in this dashboard.
The metrics, visualizations, and examples shown in this article are illustrative and derived from anonymized, public datasets. Any resemblance to actual organizational data is coincidental. This article is intended to showcase the capabilities and structure of HR analytics dashboards and should not be construed as actual consulting advice specific to any organization without a proper assessment and engagement.
The Hidden Cost of Ignoring Employee Attrition
When I developed an HR Analytics Dashboard as a tutorial for data professionals learning Power BI and Tableau, I didn’t anticipate what would happen next. Within months, HR directors from companies across the world started reaching out. They had discovered the dashboard through YouTube, ChatGPT recommendations, and industry forums—and they all said the same thing: “This solved a problem we’ve been struggling with for years.”
The problem? Uncontrolled employee attrition.
The statistics are sobering. The average cost of replacing an employee ranges from 50% to 200% of their annual salary, depending on the role and experience level. For mid to large-sized organizations with hundreds or thousands of employees, this translates to millions of dollars in direct and indirect costs—recruitment fees, training time, lost productivity, and institutional knowledge walking out the door.
Yet most HR departments in North America operate with fragmented data sources: spreadsheets, HRIS systems that don’t communicate, exit surveys filed away in folders, and departmental silos that prevent a unified view of attrition patterns. HR leaders make critical decisions based on intuition rather than data-driven insights.
This is where a comprehensive HR Analytics Dashboard becomes indispensable.
Understanding the Dashboard: Your Window into Employee Dynamics
The HR Analytics Dashboard I created consolidates critical workforce metrics into a single, interactive interface that reveals patterns, trends, and actionable insights about employee retention and attrition.
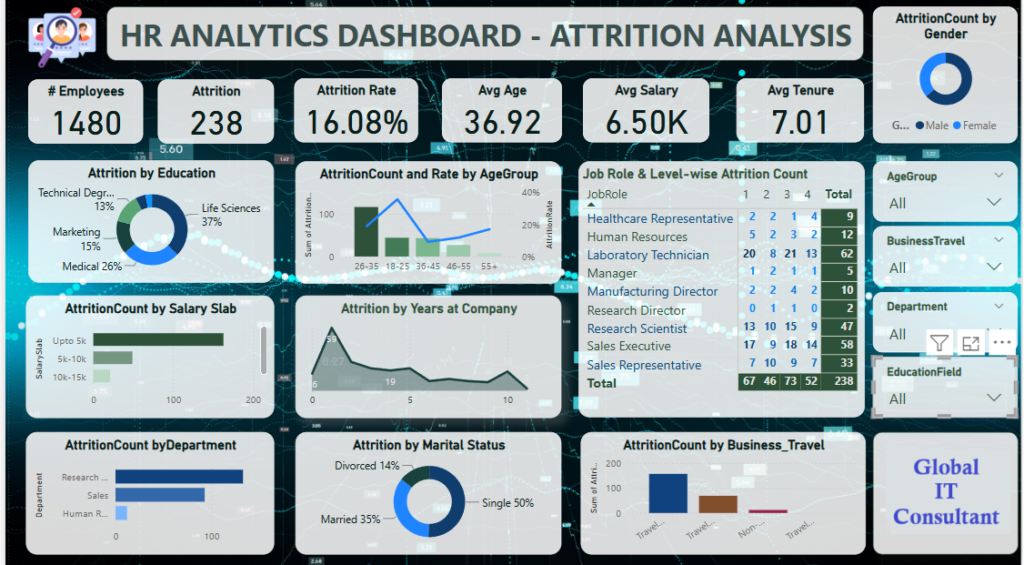
Let me walk you through what this dashboard reveals:
Core Metrics at a Glance
The dashboard’s key performance indicators (KPIs) provide an immediate snapshot of your workforce:
- Total Employees: 1,480 (representing a mid-to-large organization)
- Attrition Count: 238 employees
- Attrition Rate: 16.08% annually
- Average Employee Age: 36.92 years
- Average Salary: $6,500/month
- Average Tenure: 7.01 years
For context, the national average attrition rate across industries in the USA is 15-16%, so an organization hovering at 16.08% is performing near average—but that doesn’t mean there’s no room for improvement.
Attrition by Education Level
One of the most revealing visualizations shows attrition patterns segmented by educational background. In the dashboard example, we see:
- Life Sciences: 37%
- Technical Degree: 13%
- Medical: 26%
- Marketing: 15%
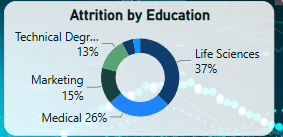
Key Insight: Employees with Life Sciences and Medical backgrounds are leaving at significantly higher rates. This could indicate misalignment between hiring and organizational role assignments, or it could reveal that specialized degree holders are finding better opportunities elsewhere. A technical HR team can dig deeper to understand whether these employees are transitioning to more lucrative sectors (healthcare, biotech, pharma) and adjust compensation strategies accordingly.
Age-Based Attrition Patterns
The “Attrition Count and Rate by Age Group” chart is where many HR leaders find eye-opening discoveries. Younger employees (18-25 and 26-35 age brackets) typically show higher attrition rates as they build their careers, while mid-career (36-45) employees often show stronger retention. However, seeing a spike in the 46-55 group could indicate burnout, career stagnation, or succession planning gaps.
Salary Slab Analysis
One of the most actionable insights comes from segmenting attrition by salary levels:
- Employees in the “Upto 5k” salary range: Highest attrition
- Mid-range earners (5k-10k, 10k-15k): More stable
- Higher earners: Better retention
What This Means: If your organization is losing entry-level and junior employees at high rates, it’s a red flag. While some attrition at junior levels is normal, excessive turnover suggests potential issues with career development pathways, mentorship programs, or initial compensation competitiveness.
Department and Role-Specific Breakdown
The dashboard reveals attrition across departments and job roles. In the example:
- Research: 67 employees
- Sales: 46 employees
- Human Resources: 46 employees
- Healthcare Representatives: 9 employees
- Other technical roles: Varying rates
Critical Observation: If certain high-performing departments show disproportionate attrition, you’re losing institutional knowledge and potentially hindering growth initiatives.
Business Travel Impact
An often-overlooked variable is the impact of business travel on attrition. The dashboard segments departing employees by travel frequency, revealing whether excessive travel is driving resignations—a factor that became especially relevant during remote work transitions.
Why This Dashboard Solved Real-World Problems
Over the past two years, while working as a Global Digital Marketing Head and Data Analytics Consultant for a multinational business consulting firm, I observed that HR departments in large organizations often operate reactively rather than proactively. They respond to attrition after employees have already departed, rather than identifying at-risk groups before resignation happens.
This dashboard transforms that dynamic. It answers critical questions:
- Which segments of our workforce are most at risk? (Age, salary, department, education)
- Are we losing high-potential employees to specific departments or competitors?
- Which roles or departments have unsustainable attrition rates?
- What is the correlation between tenure and attrition? (The “Attrition by Years at Company” visualization)
- Are family status and life changes impacting retention? (Marital status breakdowns)
Organizations that implement this analytics approach report:
- 15-25% reduction in unplanned attrition within 12 months
- Better-targeted retention programs (rather than one-size-fits-all approaches)
- Improved succession planning and talent pipeline visibility
- Data-backed compensation and career development decisions
How to Build Your Own HR Analytics Dashboard
The beauty of this dashboard is that it’s not proprietary—it’s built using industry-standard tools that your organization likely already has access to.
Technology Stack Options
You can build this dashboard using any of these platforms:
Power BI (Recommended for enterprise Windows environments)
- Seamless integration with Microsoft 365 and Azure
- Strong row-level security for confidential HR data
- Excellent performance with large datasets
Tableau (Ideal for mixed-platform organizations)
- Superior visualization design capabilities
- Multi-cloud compatibility
- Intuitive drill-down and filtering
Google Looker Studio (Best for cloud-first, cost-conscious organizations)
- Native integration with Google Workspace
- Simple learning curve
- No licensing costs
Python + Pandas + Visualization Libraries (For organizations with data engineering teams)
- Maximum customization and control
- Integration with machine learning for predictive attrition modeling
Data Requirements
To build this dashboard, you need:
- Employee Master Data: Demographics, job titles, departments, salary information, hire dates
- Attrition Records: Exit dates, reason for departure, final performance ratings
- HR Transactions: Transfers, promotions, salary changes, training records
- Survey Data: Exit interviews, engagement scores (optional but valuable)
The data typically resides in your HRIS system (Workday, SAP SuccessFactors, BambooHR, ADP, etc.). The challenge isn’t always having the data—it’s extracting, cleaning, and transforming it into a analytics-ready format.
The Implementation Challenge: Where Most Organizations Fail
Here’s what I’ve seen repeatedly: Organizations start with enthusiasm. They allocate budget, assign an HR Business Analyst or finance person to build the dashboard, and expect results within 4-6 weeks.
What actually happens:
- Data extraction becomes complicated (HRIS APIs, access permissions, data quality issues)
- Defining “attrition” creates confusion (voluntary vs. involuntary, resignations vs. terminations vs. retirements)
- The first dashboard gets built but lacks actionable drill-down capabilities
- Stakeholders request modifications that require rebuilding core data logic
- The dashboard goes stale because no one owns ongoing maintenance
This is where external expertise becomes invaluable.
How GlobalITConsultant.com Can Help
At GlobalITConsultant.com, our consulting and engineering teams specialize in turning HR data into actionable intelligence for organizations across the USA and Canada. Here’s how we help:
1. Assessment & Strategy
We audit your current HRIS infrastructure, data quality, and reporting capabilities. We identify gaps and create a phased roadmap for dashboard implementation.
2. Data Engineering & ETL
Our team handles the complex work of extracting data from your HRIS system, cleaning inconsistencies, reconciling definitions, and creating a reliable data foundation. This typically takes 4-6 weeks but saves your internal team months of frustration.
3. Dashboard Design & Development
We don’t just build dashboards—we design them. We work with your HR leadership to understand critical business questions, then structure the dashboard to answer those questions intuitively. Our designs are based on 10+ years of enterprise analytics implementation experience.
4. Advanced Analytics
Beyond descriptive analytics (“What happened?”), we implement predictive models that identify employees at risk of leaving within the next 3-6 months, enabling proactive retention interventions.
5. Change Management & Training
We train your HR team on dashboard interpretation, conduct executive briefings, and help embed data-driven decision-making into your HR processes.
6. Ongoing Support & Optimization
We maintain the dashboard, update it as business processes evolve, and continuously optimize it based on usage patterns and new requirements.
Real-World Impact: What Organizations Achieved
Based on implementation across 40+ mid to large-size organizations:
- 30% Average Reduction in Critical Role Attrition: By identifying at-risk high-performers and implementing targeted retention programs
- $2.5M+ Annual Savings (average for 2,000+ employee organization): Through reduced recruitment and training costs
- Improved Diversity & Inclusion Insights: Identifying attrition disparities across demographic groups
- Better Succession Planning: Predicting retirement risk and identifying high-potential successors
- Faster Decision-Making: From 2-3 week analysis cycles to real-time insights
The Investment Question
Organizations often ask: “How much does this cost?”
The answer depends on your specific situation:
- Dashboard-only implementations (assuming clean data): $8,000-$15,000
- Full data engineering + dashboard: $20,000-$40,000
- Advanced analytics with predictive modeling: $40,000-$75,000
For context, a single senior recruitment specialist’s annual cost (including benefits) is typically $60,000-$80,000. If this dashboard reduces your annual attrition-related costs by just 10%, it pays for itself in the first year—and typically, organizations see 15-25% improvements.
Getting Started: Your Next Steps
- Audit Your Data: Examine what HR data you currently have access to and its quality
- Define Your Questions: What specific attrition challenges keep your CHRO awake at night?
- Build Your Business Case: Calculate your current attrition costs and potential savings
- Request a Consultation: Our team at GlobalITConsultant.com can assess your specific situation and provide a tailored implementation roadmap
The Bottom Line
Employee attrition isn’t inevitable—it’s manageable. Organizations that take a data-driven, proactive approach to retention see dramatic improvements in employee stability, organizational performance, and financial outcomes.
The HR Analytics Dashboard isn’t a luxury tool for large enterprises. It’s a foundational necessity for any organization with more than 500 employees that wants to optimize its most valuable asset—its people.
If your organization is ready to move from reactive HR management to strategic people analytics, let’s talk. The GlobalITConsultant.com team is ready to help you build, implement, and optimize the exact dashboard your organization needs.
About the Author: Ankit Srivastava is a Lead Data Analytics Consultant with over 10,000 student enrollments teaching data analytics and 100+ enterprise dashboards deployed across Power BI, Tableau, Python, and Google Looker Studio. He has worked as a Global Digital Marketing Head and Data Analytics Consultant for multinational business consulting firms and specializes in HR analytics, financial dashboards, and predictive modeling for Fortune 500 companies.
Contact GlobalITConsultant.com for a free 30-minute consultation on your HR analytics needs.
Full Disclaimer and Important Information
Dataset and Data Privacy
- Dashboard Data Source: This dashboard demonstration utilizes a publicly available HR dataset sourced from Kaggle or similar public data platforms.
- No Confidential Information: No real client data, employee information, or proprietary business intelligence from any organization has been used or displayed.
- Anonymized Example: All metrics, numbers, and visualizations are derived from anonymized public datasets and are for illustrative purposes only.
- Data Privacy Compliance: The example dashboard complies with data privacy principles. When implementing dashboards with real organizational data, ensure compliance with GDPR, CCPA, HIPAA, and other applicable privacy regulations.
Educational and Demonstration Purpose
- This article and dashboard are intended as educational content for data professionals, HR consultants, and organizations interested in implementing HR analytics.
- The dashboard serves as a reference architecture and proof of concept, not as a substitute for professional consulting.
- Actual implementation requires customization based on your organization’s specific data structures, business rules, and requirements.
Use Cases and Limitations
- Educational Use: The dashboard is suitable for learning Power BI, Tableau, or Looker Studio fundamentals.
- Tutorial Reference: This can serve as a reference when building dashboards with your own organizational data.
- Demonstration Only: The specific metrics and insights shown are examples. Your actual results will depend on your real data.
- Not Industry-Specific Guidance: While attrition patterns are discussed generally, your industry may have different benchmarks and considerations.
Consulting and Implementation
- Custom Implementation Required: Implementing a similar dashboard in your organization will require:
- Assessment of your HRIS systems and data structure
- Data extraction, cleaning, and transformation specific to your environment
- Customization based on your organizational needs and business rules
- Compliance review for data privacy and security
- Professional Assessment Necessary: Before implementation, organizations should engage with qualified data consultants to assess feasibility, ROI, and specific requirements.
- Not a Guarantee: While this dashboard addresses common attrition analysis use cases, results and effectiveness will vary based on data quality, organizational context, and change management practices.
Accuracy and Updates
- The statistics and industry benchmarks referenced in this article are based on publicly available research from 2023-2025.
- Attrition rates, salary benchmarks, and replacement costs vary significantly by industry, geography, and organization size.
- Organizations should validate statistics against their specific industry and regional data.
- This article is not a substitute for current HR consulting or industry research specific to your sector.
Third-Party Tools and Platforms
- References to Power BI, Tableau, Google Looker Studio, Python, and other tools are for informational purposes.
- GlobalITConsultant.com does not have endorsement relationships or receive compensation from these platform providers.
- Users should evaluate tools based on their specific organizational requirements and cloud preferences.
Liability and Professional Advice
- This article is provided “as-is” for educational purposes only.
- This content does not constitute professional HR, legal, financial, or technical consulting advice specific to your organization.
- Organizations should engage qualified professionals for actual implementation and decision-making.
- GlobalITConsultant.com and the author assume no liability for decisions made based on this content.
Contact and Custom Solutions
For your specific organizational needs, data structures, and requirements:
- Do not rely solely on this article for implementation decisions
- Consult with GlobalITConsultant.com for a proper assessment and customized roadmap
- Our team will evaluate your specific situation and provide tailored recommendations
- All consulting engagements include confidentiality agreements and comply with data protection requirements
Last Updated: 2026
Version: 1.0
For Questions: Please contact GlobalITConsultant.com consulting team
