


Most business owners I speak with already know they have data. Sales figures sit in one system, customer records in another, and finance keeps its own spreadsheets. What they often lack is a clear answer to a simpler question: is that data being used well enough to make better decisions? That is the question a data maturity assessment is designed to answer.
Early in my career, when I was working as an Analyst for a bank, I saw how much time leaders could lose debating numbers that different departments had produced from different sources. The disagreement was rarely about the analysis. It was about governance, ownership, and trust in the data itself. Since then, across banking, finance, and analytics work, I have come to see maturity assessment as one of the most practical diagnostic tools a company can use. This article explains what it measures, how to read the results, and what a business owner can do with them.
What a Data Maturity Assessment Actually Measures
A data maturity assessment scores how well an organization manages and uses its data. It does not judge whether you have expensive software or a large team. A company with modest tools can score well if its processes are sound, and a company with an impressive technology stack can score poorly if nobody owns its data quality.
Most frameworks look at four broad areas, and the dashboard our team built for this kind of analysis follows the same logic:
- Data strategy: whether data goals are linked to business goals, and whether leadership has a plan for how data will create value.
- Data governance: who is responsible for data definitions, quality, access, and compliance, and whether those responsibilities are written down and followed.
- Data culture: whether people trust data, use it in everyday decisions, and have the skills to question it.
- Technology infrastructure: whether systems can store, integrate, and analyze data reliably at the scale the business needs.
Each area receives a score, and those scores combine into an overall maturity score. The value lies less in the single number than in the pattern across the areas, because the pattern tells you where to act first.
Reading the Dashboard: What the Numbers Are Telling Us
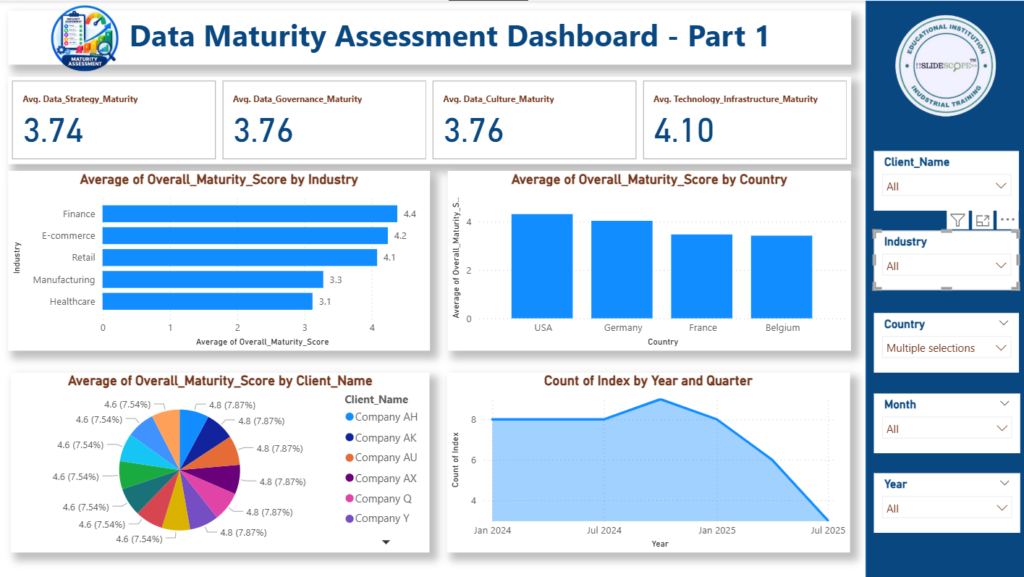
The dashboard we developed brings together assessment results across clients, industries, and countries, and it allows filtering by industry, country, client, and time period. I want to be clear about what it does and does not show. The figures discussed here come from the sample dataset we used to build and test the dashboard. They are not a benchmark that tells you where your company should stand, but they do illustrate patterns that are worth understanding.
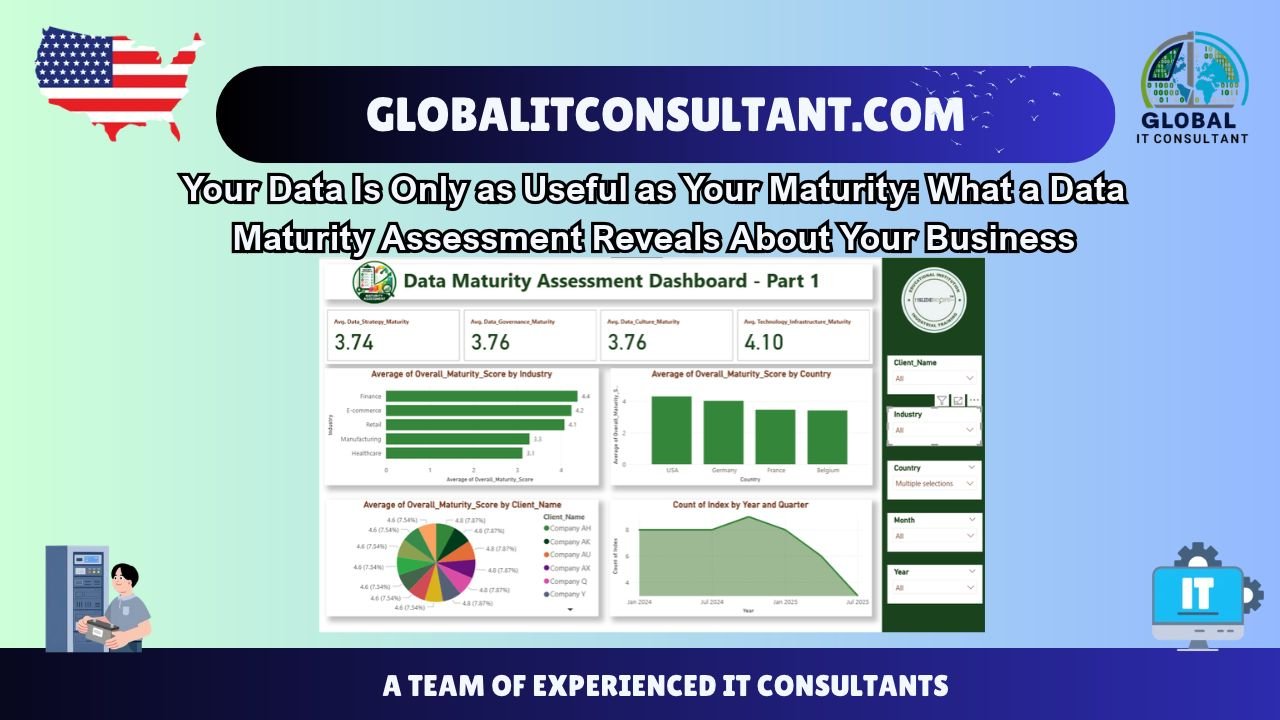
Technology infrastructure leads, and strategy and governance trail. Across the dataset, the average technology infrastructure score is about 4.10, while data strategy averages about 3.74 and data governance and data culture both sit near 3.76. This is a pattern I have seen repeatedly in real organizations. Companies invest in tools and platforms first, because they are visible and easy to budget for. The harder work of deciding what the data is for, who owns it, and how it should be trusted tends to lag behind. A business can have excellent pipelines and still make poor decisions if no one agrees on what “active customer” means.
Industry makes a visible difference. In the dataset, finance has the highest average overall maturity score at about 4.4, followed by e-commerce at about 4.2 and retail at about 4.1. Manufacturing averages around 3.3, and healthcare around 3.1. Finance is a sector where regulation has long required disciplined data handling, so the result is not surprising. Healthcare’s lower average is worth noting too, since its data is often highly valuable but spread across systems that were not designed to talk to one another. A low score in such an industry does not mean a company is failing. It means there is a clear, specific gap to close.
Geography shows variation too. The country view shows the United States with the highest average overall score, at roughly 4.3, followed by Germany at about 4.0, France at about 3.5, and Belgium at about 3.4. Country averages can reflect many things, including the number of assessments in each country and the industries represented. For a business owner, the useful takeaway is not that one country is ahead, but that regulatory environment, talent availability, and industry mix all shape where an organization starts.
Client-level scores reveal who is ready to move. The client view shows several organizations clustered closely around 4.6 to 4.8. When many companies score similarly, the differences between them often come down to execution: how consistently they apply their standards and how well they track progress. The client breakdown is most useful when a company compares itself against its own past results, not against others.
Timing data needs careful interpretation. The chart of assessment counts by year and quarter rises to a peak around the second half of 2024, then declines through mid-2025. It would be easy to read that as a market trend, but it more likely reflects when the sample data was collected. Business owners should be cautious about drawing conclusions from volume charts unless they know how the data was gathered.
Why Business Owners Should Care
If you run a business, you may wonder why a maturity score matters when revenue, margins, and customer satisfaction are what you track daily. The answer is that maturity drives the quality of those outcomes. Three problems I see most often explain why.
The first is decision delay. When two departments report different revenue figures, meetings turn into arguments about the numbers rather than discussions about action. A governance gap has a direct cost in time and confidence.
The second is wasted technology spending. Buying a new analytics platform rarely fixes a problem rooted in unclear ownership. Companies that skip the diagnostic step often purchase tools that sit underused, then conclude that analytics “doesn’t work for us.”
The third is missed opportunity. Customer patterns, pricing signals, and operational inefficiencies are often visible in existing data. Without a clear strategy for using that data, those signals stay hidden in reports nobody reads.
A maturity assessment turns these vague frustrations into a specific list of priorities.
What to Do With the Results
An assessment is only valuable if it leads to action. Based on the work I have done, I recommend a practical sequence for business owners.
Start with strategy before software. Write down three to five business decisions that would improve if the right data were available. Examples include which customers to prioritize, which products to discontinue, or where to reduce costs. This list becomes the test for every data investment that follows.
Name a data owner for each critical dataset. Choose one person accountable for the definition, quality, and access rules for customer, sales, and financial data. Ownership does not require a new department. It requires a clear name and a clear expectation.
Agree on core definitions. Before building any dashboard, settle how key terms are calculated. Revenue, churn, active customer, and qualified lead should each have one written definition that every team uses.
Build trust gradually. Culture changes when people see that data helps them do their jobs. Start with one report that a team genuinely needs, make sure it is accurate, and expand from there.
Reassess on a schedule. Run the assessment again after six to twelve months. The most useful insight comes from comparing your own scores over time, which shows whether your actions are working.
How We Support Businesses Through Maturity Assessment
Our team offers maturity assessment analysis services that help companies understand their results and act on them. The dashboard described above is one of the tools we use. Our work typically includes reviewing the assessment responses, identifying the strongest and weakest areas, comparing results against relevant industry patterns where data is available, and translating the findings into a prioritized plan that a business owner can actually execute.
We do not believe a single score should determine a company’s future. Our role is to make the data understandable, to point out where the evidence is strong and where it is limited, and to help leaders decide what to do next. Where the results suggest a need for deeper work, such as data integration, analytics development, or compliance support, we can discuss those options, but we always start with the diagnosis.
If you want a clearer picture of where your organization stands, the first step is an honest assessment. You can also read our earlier article on what maturity assessment is and why it matters, which covers the foundations in more detail.
A Note on Limitations
No assessment captures everything. Self-reported scores can reflect how confident an organization feels rather than how it actually performs. Sample sizes in some industries and countries are small, which makes averages sensitive to a few responses. The framework also cannot tell you how well your data will support a specific product idea or market entry. Treat the results as a structured starting point for conversation, not a verdict.
Conclusion
Data maturity is not a technical luxury reserved for large enterprises. It is a practical measure of whether your organization can trust its information and use it to make decisions. The patterns in our dashboard, with technology often ahead of strategy and governance, match what many businesses experience. The good news is that these gaps are specific and addressable.
If you are a business owner who suspects your data is not working as hard as it should, begin with a clear assessment, choose two or three priorities, and measure your progress honestly. Small, disciplined steps on governance and strategy often produce more value than the next software purchase. Our team is ready to help you take those steps with evidence you can trust.
