


Marketing has changed dramatically. A business can now advertise on Google, Meta, LinkedIn, YouTube, email, marketplaces, websites, mobile apps, and dozens of other channels at the same time. Add multiple countries, customer segments, products, campaigns, and sales teams, and the amount of marketing data becomes enormous.
The problem is not a lack of data.
The problem is understanding what the data is actually telling you.
I have worked with dashboards, data analytics, digital marketing, and business reporting for years, and one pattern keeps appearing: companies often have plenty of marketing information, but that information is scattered across spreadsheets, advertising platforms, CRM systems, websites, email tools, and internal reports.
A marketing performance dashboard brings that information together and turns it into something decision-makers can actually use.
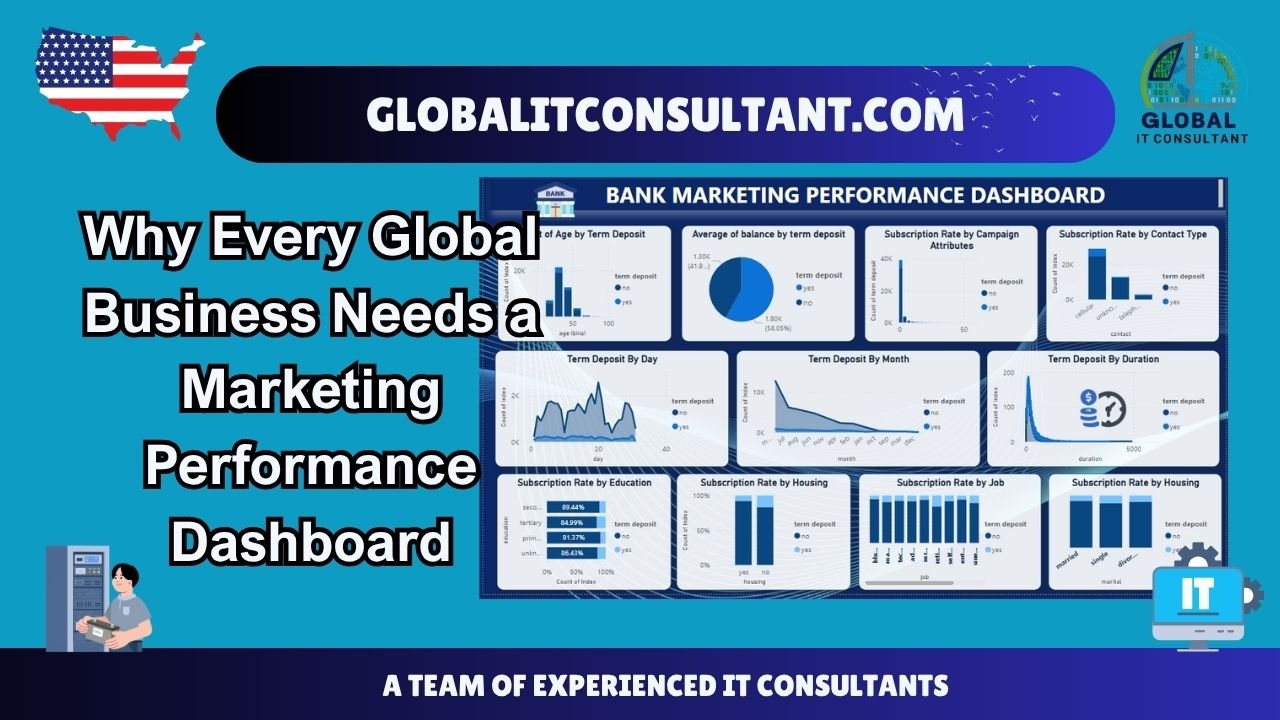
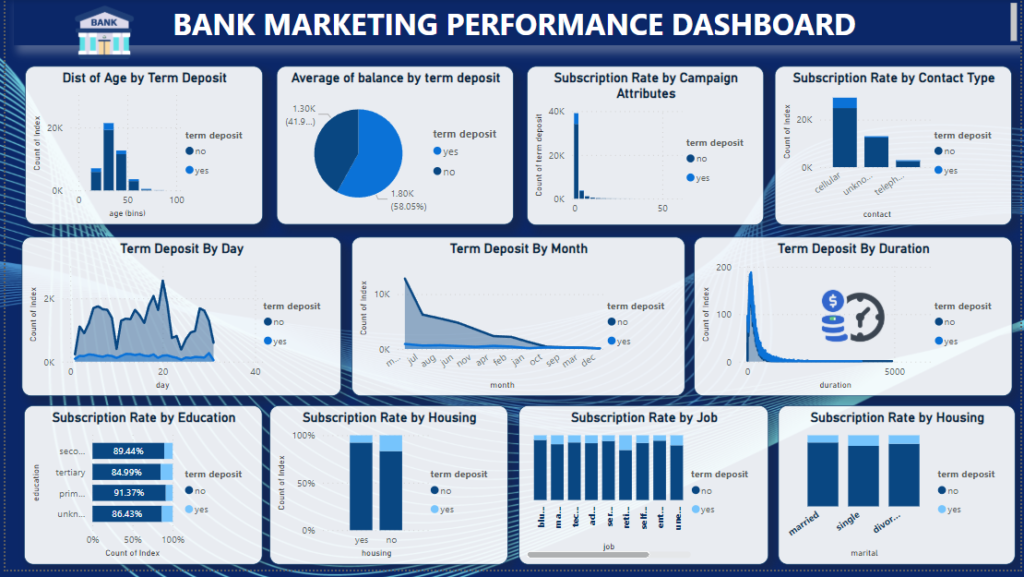
The dashboard shown above is a sample banking marketing dashboard. It examines factors such as age, campaign attributes, contact type, education, housing status, job category, duration, month, day, and term-deposit subscription. The dataset is only an example, but the underlying concept can be applied to almost any industry.
At Global IT Consultant, data analytics is positioned around actionable insights, dashboards, and predictive models because businesses need more than raw information—they need visibility that supports decisions.
The Real Problem: Marketing Data Is Everywhere
Imagine a global company operating in the United States, United Kingdom, Germany, Australia, India, Canada, and Singapore.
The marketing team may be running:
- Google Ads
- Meta campaigns
- LinkedIn advertising
- Email campaigns
- SEO
- Content marketing
- Influencer campaigns
- Affiliate marketing
- Events
- SMS campaigns
- Retargeting
- Offline promotions
Every platform produces its own metrics.
Google may report clicks and conversions. Meta may report reach, engagement, and attributed conversions. The CRM may contain qualified leads. The sales team may track opportunities and revenue. The website analytics platform may show customer journeys.
Now ask the CEO one simple question:
“Which marketing activities are actually producing customers?”
That answer can become surprisingly difficult.
A dashboard solves part of this problem by creating a centralized visual layer where important information can be viewed together.
Instead of asking five different departments for five different spreadsheets, management can begin with one analytical environment.
A Dashboard Is Not Just a Collection of Charts
One common mistake is thinking that a dashboard means putting ten charts onto a screen.
That is not the objective.
A useful marketing dashboard should answer business questions.
For example:
- Which customer segments convert most frequently?
- Which campaign generates the strongest response?
- Which channels produce qualified leads?
- Which regions are underperforming?
- Which products attract particular customer groups?
- Does customer behavior change by age?
- Does campaign performance vary by month?
- Which contact method produces better engagement?
- Where are marketing resources being wasted?
- What has changed compared with previous periods?
The banking example demonstrates this principle clearly.
The dashboard does not simply display customer records. It organizes the data around meaningful dimensions such as age, campaign attributes, contact type, education, housing, job, marital status, duration, day, and month.
That allows an analyst to move from “what happened?” toward “what patterns exist?”
That difference is extremely important.
Understanding Customer Segments
One of the biggest advantages of marketing dashboards is segmentation.
A global company rarely has one homogeneous customer.
Customers differ by:
- Age
- Gender
- Geography
- Income
- Industry
- Job role
- Education
- Buying behavior
- Product interest
- Previous interactions
- Customer lifecycle stage
A dashboard can make these differences visible.
For example, a company might discover that younger customers interact heavily with social campaigns while older customers respond more strongly to email or direct communication.
That does not automatically mean the company should abandon one channel. Instead, it creates a question worth investigating.
Why is the behavior different?
Is the difference caused by messaging, pricing, channel preference, product suitability, timing, or campaign targeting?
This is where dashboards become analytical tools rather than reporting screens.
Measuring Campaign Performance
Campaign analysis is another major use case.
Suppose a company runs 20 campaigns across six countries.
A traditional reporting process might involve collecting reports from individual marketing managers and combining them manually.
That process takes time, and manual consolidation can introduce inconsistencies.
A dashboard can organize campaigns around standardized metrics.
Depending on the business model, these could include:
- Impressions
- Clicks
- Engagement
- Leads
- Qualified leads
- Conversions
- Conversion rate
- Cost per lead
- Customer acquisition cost
- Revenue
- Return on advertising spend
- Marketing ROI
The important point is that metrics should be connected to business objectives.
Getting 100,000 impressions is not automatically valuable if the campaign generates no meaningful business outcome.
Similarly, a campaign with fewer clicks could be commercially important if those visitors have a substantially higher conversion rate.
A dashboard helps management see those relationships.
Geographic Marketing Becomes Easier
Global businesses face another challenge: performance varies between markets.
A campaign that performs well in Australia may not perform similarly in Germany.
A product message that works in the United States may require adaptation for India.
A dashboard can introduce geographic dimensions into marketing analysis.
Management can compare:
Country → Campaign → Channel → Customer Segment → Conversion
That structure can reveal patterns that are hidden inside aggregate global numbers.
Instead of saying, “Our campaign generated 20,000 leads,” management can ask:
Where did those leads come from?
Which markets produced qualified leads?
Which countries generated revenue?
Which regions had high acquisition costs?
Which markets are growing?
Which markets require different messaging?
This is particularly valuable for multinational organizations because global averages can hide regional differences.
Time-Based Analysis Reveals Hidden Patterns
The sample dashboard also includes daily and monthly analysis.
This is another area where dashboards become useful.
Marketing performance is rarely constant throughout the year.
Customer behavior can change because of:
- Seasonality
- Holidays
- Economic conditions
- Product launches
- Competitor activity
- Promotional periods
- Budget cycles
- Industry events
- Weather
- Local market conditions
A monthly chart can show whether performance is gradually increasing, declining, or fluctuating.
A daily view can reveal unusual spikes or drops.
This gives analysts a starting point for investigation.
For example, if conversions suddenly fall on a particular date, the dashboard can prompt the team to investigate whether there was a website problem, tracking issue, campaign change, budget reduction, or genuine change in customer demand.
Without visual trend analysis, these anomalies can easily disappear inside spreadsheets.
Dashboards Help Marketing and Sales Work Together
Another important benefit is alignment between marketing and sales.
Marketing may report 5,000 leads.
Sales may say only 300 were genuinely useful.
These two numbers are not necessarily contradictory, but they measure different stages of the customer journey.
A mature dashboard can connect marketing activity with downstream outcomes.
For example:
Campaign → Lead → Qualified Lead → Opportunity → Customer → Revenue
Now marketing teams can understand not only how many leads they generated, but what happened to those leads afterward.
This changes the conversation.
Instead of asking:
“How many leads did marketing generate?”
the business can ask:
“What business value did those leads eventually create?”
That is a much more meaningful question.
Better Budget Allocation Through Visibility
Marketing budgets are finite.
Whether a company spends $50,000 or $50 million, management still needs to understand where the money is going.
A dashboard can help identify areas that deserve further investigation.
For example, imagine three channels producing different results:
| Channel | Spend | Leads | Customers | Revenue |
|---|---|---|---|---|
| Search | $50K | 2,000 | 180 | $400K |
| Social | $70K | 4,500 | 120 | $250K |
| $20K | 1,200 | 150 | $350K |
The largest number of leads does not necessarily correspond with the largest commercial outcome.
A dashboard makes these relationships easier to see.
The next step should still involve deeper analysis—attribution methodology, margins, customer lifetime value, campaign quality, and other factors—but the dashboard provides the visibility needed to ask those questions.
Executive Reporting Becomes Much Faster
Senior executives generally do not want to inspect thousands of rows in Excel.
They want answers.
How much did we spend?
How much revenue did marketing influence?
Which regions are growing?
Which campaigns are producing results?
What changed this month?
Where should management investigate further?
A well-designed dashboard can provide the first layer of answers immediately.
This is one reason I consider dashboard design a combination of data analytics and business communication.
The data needs to be correct, but the presentation also needs to make sense.
A dashboard should guide the viewer toward important information rather than overwhelm them with every available metric.
Why Global Businesses Need These Dashboards Now
The larger a business becomes, the more difficult manual reporting becomes.
A startup might survive with a few spreadsheets.
A growing company may introduce CRM software and dedicated marketing platforms.
A multinational organization can eventually have dozens or hundreds of systems generating information.
At that point, the challenge becomes integration.
Global IT Consultant’s current service offering includes Data Analytics Consulting focused on actionable insights, dashboards, and predictive models, alongside digital strategy and business consulting.
That combination matters because technology alone does not solve reporting problems.
A business needs to determine:
What should we measure?
Why should we measure it?
Where does the data come from?
How frequently should it update?
Who will use it?
What decisions should it support?
These questions should be answered before building dozens of visualizations.
Choosing the Right Dashboard Technology
Different businesses require different technologies.
Power BI can be useful for organizations heavily invested in the Microsoft ecosystem.
Tableau can support sophisticated visualization and analytical requirements.
Looker Studio can work well for organizations looking for accessible cloud-based reporting.
Python can be used when businesses require custom analytics, automation, or advanced data processing.
The technology is important, but I would not start with the software.
I would start with the business problem.
A beautiful dashboard built on unreliable data is still an unreliable dashboard.
Data quality, definitions, refresh schedules, security, access control, and governance all matter.
From Descriptive Analytics to Predictive Analytics
The dashboard shown here is primarily descriptive.
It tells us what happened and allows us to examine patterns.
But businesses can eventually move further.
Once reliable historical data is available, organizations can introduce predictive analytics.
For example:
- Which customers may be most likely to convert?
- Which leads may require follow-up?
- Which campaigns could experience declining performance?
- Which customer segments show increasing demand?
- Which products may require additional marketing investment?
This creates a progression:
Data → Dashboard → Insight → Analysis → Prediction → Action
That is where business analytics becomes increasingly valuable.
The Dashboard Should Evolve With the Business
A dashboard should not be considered a one-time project.
As the company grows, its questions change.
A small company may initially need:
Leads + Campaigns + Conversions
Later it may require:
Revenue + Customer Acquisition Cost + ROI + Region + Product
A mature organization may add:
Customer Lifetime Value + Forecasting + Attribution + Predictive Models + Automated Alerts
This means dashboard development should be scalable.
The objective is not to build the biggest dashboard.
It is to build a reporting system that can evolve alongside the organization.
My Final View
After working with data analytics and digital business systems, I have become convinced that the biggest value of a dashboard is not the chart itself.
It is the visibility behind the chart.
The banking marketing dashboard shown above is only a sample dataset, but it demonstrates a broader concept that applies to financial services, retail, manufacturing, healthcare, SaaS, eCommerce, logistics, professional services, and many other industries.
Every business generates data.
The real question is whether that data is being converted into useful business intelligence.
A marketing performance dashboard can bring fragmented information into one analytical environment, help teams understand customer segments, monitor campaigns, identify trends, compare markets, connect marketing with sales, and communicate performance to management.
For global businesses, this becomes particularly important because complexity increases rapidly as countries, products, channels, customers, and teams multiply.
You do not necessarily need more reports.
You need better visibility into the reports and data you already have.
That is the real purpose of a modern marketing dashboard: not to make data look impressive, but to make business information easier to understand, investigate, and use.
At Global IT Consultant, our approach to analytics is centered on turning complex business data into actionable insights through dashboards, analytics solutions, and broader digital transformation capabilities.
And that, in my opinion, is where the real value of business intelligence begins.
— Ankit Srivastava
