



The eLearning industry in the United States has created enormous opportunities for online education providers, corporate training companies, professional certification platforms, and digital learning businesses. However, as competition increases, attracting students is only one part of the challenge. Education businesses must also understand their revenue, student engagement, course performance, completion rates, instructor effectiveness, and customer satisfaction.
This is where Business Intelligence (BI), data analysis, and reporting services become valuable.
I am Ankit, and in this article, I will explain how the team at GlobalITConsultant.com can help eLearning businesses in the USA turn their educational and commercial data into meaningful business insights. Using an E-Learning Business Intelligence Dashboard as our example, we will explore how a centralized reporting solution can help education providers monitor performance, identify opportunities, and make informed decisions.
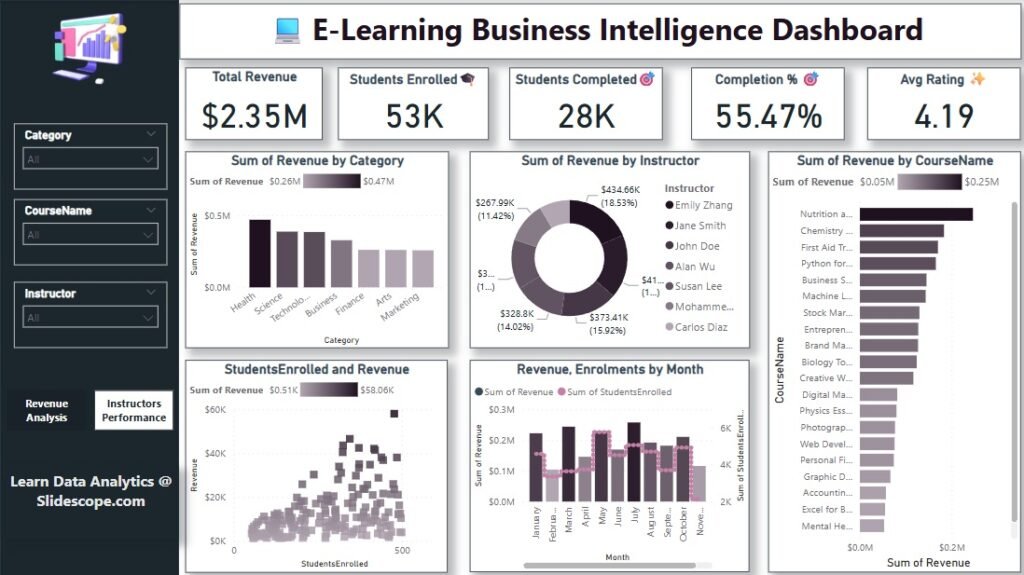
The dashboard brings several important metrics together, including total revenue, student enrolments, completed courses, completion percentage, average ratings, category-level revenue, instructor performance, and monthly trends. Instead of reviewing multiple spreadsheets and disconnected reports, business owners can use a single reporting environment to understand what is happening across their learning business.
Why eLearning Businesses Need Data Analysis Consulting
Many online education companies collect data from learning management systems (LMS), course marketplaces, payment gateways, customer relationship management (CRM) platforms, email marketing tools, and website analytics systems.
The problem is that collecting information does not automatically produce useful insights.
An eLearning business might know how many students enrolled in a course, but does it know which courses generate the strongest revenue? Does it understand why students abandon particular programmes? Can it identify instructors associated with higher learner satisfaction? Does it know whether enrolments are increasing while completion rates are declining?
These questions require structured data analysis.
Global IT Consultant can help eLearning businesses establish reporting systems that bring relevant data together, calculate meaningful performance indicators, and present results through clear dashboards.
1. Understand Revenue and Business Performance
Revenue is one of the first metrics education businesses need to monitor. However, overall revenue alone cannot explain which products are performing well.
An eLearning provider may generate income through individual courses, subscription plans, professional certifications, corporate training programmes, bundled learning packages, and instructor-led sessions.
By analysing revenue across these categories, management can identify which offerings contribute most to business performance.
A Business Intelligence dashboard can also compare revenue across months, courses, instructors, and other relevant dimensions. This makes it easier to investigate changes and evaluate opportunities for improvement.
2. Improve Student Enrolment and Retention
Student enrolment figures provide an overview of demand, but enrolment data should be examined alongside learner engagement and course completion.
For example, a course may attract thousands of students but have a low completion rate. Another course may attract fewer students but achieve stronger completion and satisfaction.
These patterns may suggest opportunities to improve course structure, onboarding, learning materials, support, or marketing strategies.
With appropriate data, eLearning businesses can investigate where students disengage and develop targeted interventions to improve the learning experience.
Exploring the E-Learning Business Intelligence Dashboard
The dashboard featured in this article demonstrates how educational business data can be transformed into an interactive reporting solution.
It combines headline KPIs, category-level analysis, instructor comparisons, course revenue rankings, student enrolment data, and monthly trends. Filters for category, course name, and instructor allow users to explore different parts of the business.
The example shows how a well-designed dashboard can make complex information easier to understand for business owners, education managers, marketing teams, and academic operations teams.
The figures displayed are illustrative dashboard values, not independently verified performance claims about any particular eLearning company.
Five Important KPIs for eLearning Businesses
1. Total Revenue
The dashboard displays total revenue of approximately $2.35 million.
This headline metric gives management a quick view of the revenue represented in the dataset.
However, revenue becomes more valuable when examined alongside course performance, enrolment trends, instructor contributions, and monthly changes.
An analytics team can help determine whether revenue growth comes from increased enrolments, higher course prices, new programmes, repeat purchases, or a change in the mix of courses sold.
These distinctions matter because different causes may require different business strategies.
2. Students Enrolled
The dashboard displays approximately 53K students enrolled.
Enrolment is an important indicator of demand, but it should not be interpreted in isolation.
A business should examine enrolments by course, category, instructor, marketing channel, and month wherever those fields are available.
For example, if enrolments increase after a marketing campaign, analysts can investigate whether the campaign also generates paying students, stronger completion, and satisfactory returns on marketing expenditure.
This helps management distinguish between activity and meaningful business results.
3. Students Completed
The dashboard reports approximately 28K students completed.
Course completion is important because enrolment alone does not demonstrate that learners have achieved their educational objectives.
Low completion can have several causes, including course difficulty, limited learner support, scheduling conflicts, poor onboarding, or a mismatch between course expectations and actual content.
Data analysis can help identify which courses have unusual completion patterns and where further investigation may be necessary.
Completion figures should also be interpreted carefully: businesses must define whether completion means finishing a course, passing an assessment, earning a certificate, or meeting another specified requirement.
4. Completion Percentage
The dashboard displays a completion percentage of 55.47%.
This metric can help education providers monitor how effectively students progress through their programmes.
For meaningful reporting, the numerator and denominator must be clearly defined. For example, completed students divided by enrolled students may produce a misleading rate if the two figures represent different enrolment cohorts or time periods.
A more reliable approach is to measure completion for a defined group of students enrolled during a specified period and track their progress over an appropriate timeframe.
Global IT Consultant can help establish these definitions so that business leaders can compare performance consistently.
5. Average Student Rating
The dashboard reports an average rating of 4.19.
Ratings can provide a useful indication of learner satisfaction, particularly when combined with course feedback, completion rates, refund data, and support requests.
An overall average may hide important differences between individual courses or instructors. A course with a strong rating and a small number of reviews should not automatically be considered better than a course with a similar rating based on a much larger number of responses.
By analysing rating distributions and response volumes, businesses can identify courses that may benefit from content improvements or additional student support.
How Course-Level Reporting Helps Identify Growth Opportunities
The dashboard includes a horizontal bar chart showing revenue by course name. This is particularly useful for eLearning companies offering dozens or hundreds of programmes.
Course-level reporting helps answer several important questions:
- Which courses generate the highest revenue?
- Which programmes attract the most enrolments?
- Which courses have strong enrolment but weak completion?
- Which courses receive lower student ratings?
- Which programmes may benefit from additional marketing investment?
For example, a course generating substantial revenue may justify further investment in content updates, instructor resources, and promotional activities. Meanwhile, a course with consistently weak performance may require a review of pricing, positioning, or learning outcomes.
The goal is not to discontinue courses simply because their revenue is low. Analysts should also consider course delivery costs, strategic importance, student demand, and long-term business objectives before recommending changes.
Instructor Performance and Revenue Analysis
The dashboard includes a doughnut chart showing revenue by instructor.
For education businesses, instructor performance analysis can help management understand how different programmes contribute to commercial results.
However, revenue should not be the only measure of instructor effectiveness.
A more comprehensive reporting framework could combine instructor-related revenue with student ratings, completion rates, enrolment numbers, learner feedback, and course delivery costs.
This approach provides a more balanced view of performance.
For example, an instructor whose course has high completion and satisfaction may be well positioned to develop an advanced programme. Another instructor may need additional support if students repeatedly report difficulties with the learning material.
These insights can support better resource allocation, instructor development, and course planning.
Monthly Reporting for Better Business Decisions
The dashboard also compares monthly revenue and student enrolments.
Monthly reporting helps business owners understand changes in demand, identify seasonal patterns, and evaluate whether business initiatives are producing the expected results.
When combined with marketing campaign data, monthly reporting can help answer questions such as whether a promotional campaign increased paid enrolments, whether a new course launch generated additional revenue, and whether student acquisition costs are improving.
For subscription-based education providers, the analysis can be expanded to include recurring revenue, cancellations, renewals, and customer lifetime value.
A reporting solution can also compare actual performance against business targets, making it easier for management to identify gaps and decide where corrective action is required.
How Global IT Consultant Can Help eLearning Businesses in the USA
At GlobalITConsultant.com, our Data Analysis Consulting and Reporting Services can help education businesses transform disconnected information into a structured reporting environment.
Data Integration and Preparation
We can help businesses organize information from supported sources such as spreadsheets, databases, LMS platforms, CRM systems, and sales reports.
The objective is to establish consistent data definitions and prepare information for reliable analysis.
Business Intelligence Dashboard Development
We can develop dashboards that present revenue, enrolments, course performance, completion rates, student ratings, and other business-specific KPIs.
Depending on the requirements, solutions can be developed using tools such as Microsoft Power BI, Excel, or other suitable reporting technologies.
Customized Reporting Services
Different eLearning businesses require different reports.
An executive may need a high-level performance summary, while a marketing manager may need acquisition and campaign reporting. An academic manager may focus on completion, learner satisfaction, and instructor performance.
Customized reporting ensures that each team receives relevant information for its decisions.
Advanced Analytics and Forecasting
Once reliable historical data is available, businesses may also explore forecasting and predictive analytics.
These techniques can help estimate future enrolment demand, identify potential revenue trends, and investigate patterns associated with student disengagement.
Predictions should be validated against actual outcomes, and any student-risk analysis should be designed responsibly, with appropriate privacy protections and human oversight.
Conclusion: Turn eLearning Data Into Business Intelligence
The eLearning Business Intelligence Dashboard demonstrates how revenue, student enrolments, course completion, instructor performance, course rankings, and monthly trends can be brought together in a single reporting environment.
For eLearning businesses in the United States, the opportunity extends beyond creating attractive charts. The real objective is to establish reliable reporting that helps management understand performance, identify problems, evaluate growth opportunities, and make informed decisions.
Global IT Consultant can help your organization develop a data analysis and reporting approach aligned with its business goals, existing systems, and operational requirements.
Looking to improve your eLearning business reporting?
Contact GlobalITConsultant.com to discuss Data Analysis Consulting and Reporting Services for your organization. Whether you need an Excel dashboard, a Power BI solution, course performance analysis, or a customized business reporting framework, our team can help you explore the right approach for your needs.
Visit https://globalitconsultant.com/ to learn more and discuss your requirements.
