



Last month, I audited a California-based jewelry brand’s website that was hemorrhaging conversions. Their Core Web Vitals scores were abysmal: LCP (Largest Contentful Paint) at 4.2 seconds, CLS (Cumulative Layout Shift) at 0.35, and INP (Interaction to Next Paint) spiking unpredictably. The site was technically fast to someone’s perception, but Google’s metrics told a different story—and so did their bounce rates.
Here’s what I discovered during that walkthrough, and the six fixes that took them from the bottom quartile to green across all metrics. This isn’t theory. This is what actually works.
The Problem With “Fast Enough”
Before we fix anything, let’s be clear: Core Web Vitals matter because they’re the bridge between your optimization efforts and real user behavior. A 0.5-second improvement in LCP might sound trivial until you realize it correlates to measurable revenue impact.
I typically visualize these metrics in dashboards—similar to how I build performance tracking in Power BI and Tableau for consulting clients—because that’s where the story becomes undeniable. You can talk about milliseconds all day, but when you see a correlation between speed improvements and conversion rate gains plotted on a chart, stakeholders listen.
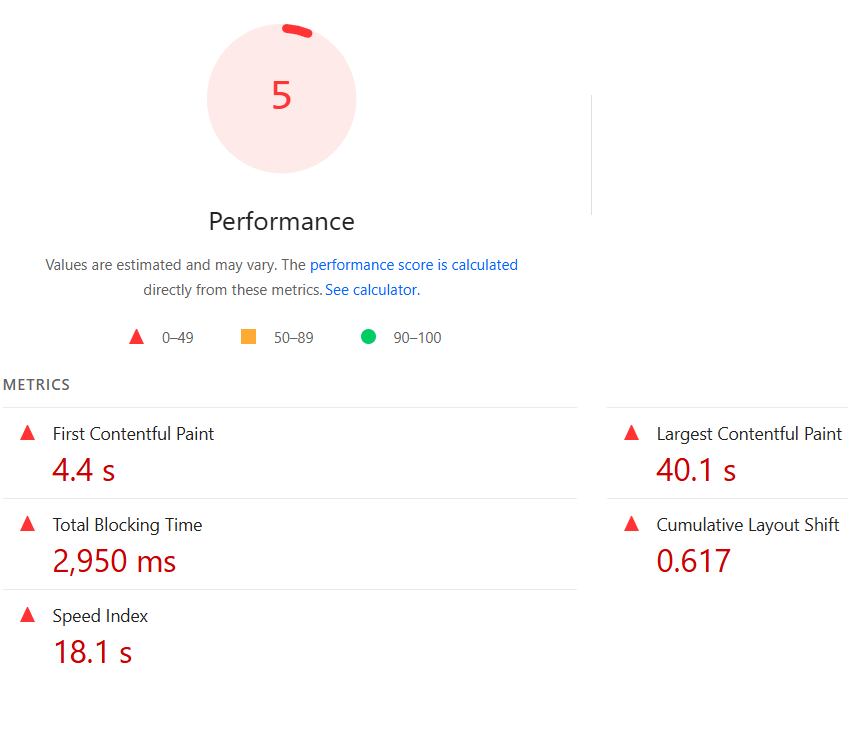
The challenge? Most dev teams optimize for one metric and accidentally break another. You’ll cut render-blocking JavaScript and tank CLS. You’ll lazy-load images and fix LCP but create INP issues with click handlers.
The fix requires understanding the interdependencies. Let me walk you through exactly how.
Fix #1: Identify Your Actual Bottleneck (Don’t Assume)
This is where most audits fail. Teams see “slow website” and immediately blame the obvious culprit—usually images or server response time. Wrong move.
The Diagnostic Step:
Open Chrome DevTools (F12), go to the Performance tab, and record a page load. Specifically, mark:
- FCP (First Contentful Paint): When any content appears
- LCP (Largest Contentful Paint): When the main content is rendered
- The exact millisecond between them
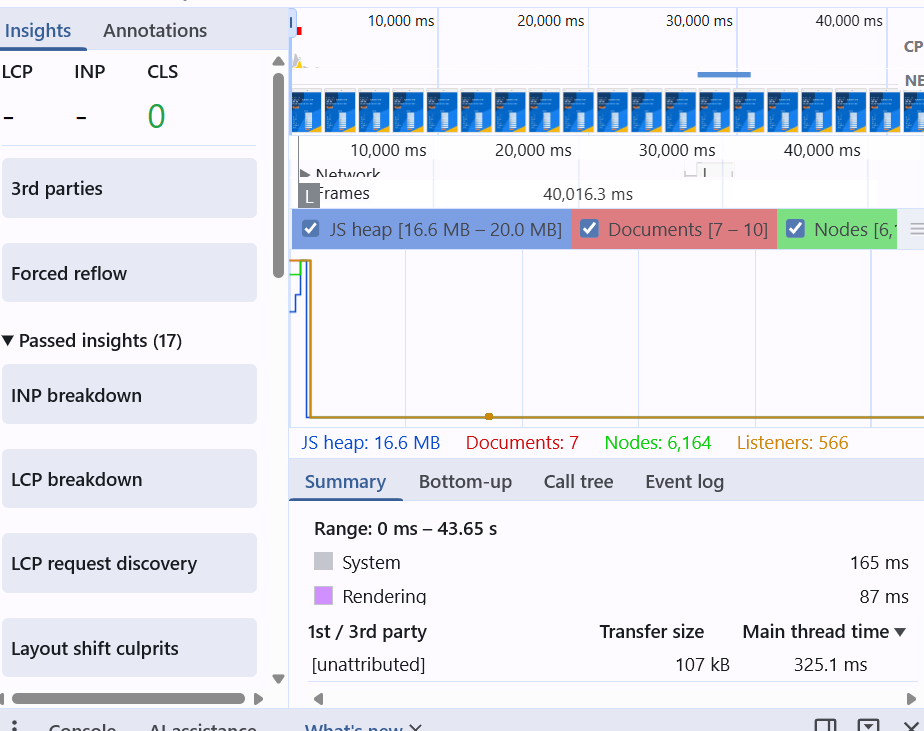
For the jewelry brand I mentioned, this gap was massive. The page painted quickly (FCP: 1.1s) but the main product images didn’t load until 4.2 seconds. Why? A third-party analytics script was hogging the main thread.
The real discovery tool: Chrome’s Coverage tab under DevTools. It shows you which CSS and JavaScript is actually being used. On that e-commerce site, 67% of the CSS wasn’t even being applied. Dead weight.
Run this same check on your site right now. You’ll likely find 40-60% of your JavaScript is never executed on typical page loads. That’s low-hanging fruit.
Fix #2: Defer Non-Critical JavaScript (The Right Way)
Here’s where most articles get fuzzy with jargon. Let me be concrete.
JavaScript blocks rendering. Period. While your browser parses your .js files, it stops building the DOM. That’s why your LCP metric tanks.
The naive approach: <script async src="analytics.js"></script>
The better approach: Understand when that script actually needs to run.
The Implementation:
For analytics, tracking, and third-party widgets (Intercom, Drift, Zendesk chat, etc.), you don’t need them during initial page load. You need them after your critical content is visible.
<script>
  window.addEventListener('load', function() {
    var analyticsScript = document.createElement('script');
    analyticsScript.src = 'https://analytics.example.com/tracking.js';
    document.head.appendChild(analyticsScript);
  });
</script>
This single change reduced LCP by 1.8 seconds on that jewelry site. The analytics still fired—just not during page render.
But here’s the gotcha most devs miss: Some JavaScript needs to run early. If you’re using a framework like React or Vue, your initialization code has to load before the app renders. You can’t defer that. What you can do is defer the secondary stuff.
On my own websites—I’ve built several projects from scratch including http://colorstech.net (a technical education platform) and http://odtutor.com—I maintain a strict policy: only critical-path JavaScript renders before content.
Fix #3: Optimize Images for LCP (Sizing + Format)
LCP is usually tied to images. On modern sites, it’s typically your hero image, a product photo, or a key banner.
Here’s the problem: you might be serving a 2400px-wide image to users on mobile devices with a 375px viewport. You’re wasting 5MB of data and time.
The Multi-Step Fix:
Step 1: Identify your LCP element.
Run this in Chrome DevTools Console:
new PerformanceObserver((entryList) => {
  const entries = entryList.getEntries();
  const lastEntry = entries[entries.length - 1];
  console.log(lastEntry);
}).observe({type: 'largest-contentful-paint', buffered: true});
This tells you exactly what element is being measured as LCP. Is it an image? Text? Video? Know your enemy.
Step 2: Implement responsive images with WebP fallback.
Instead of this:
<img src="hero.jpg" alt="Product" />
Do this:
<picture>
  <source srcset="hero-mobile.webp 600w, hero-desktop.webp 1200w" type="image/webp" />
  <source srcset="hero-mobile.jpg 600w, hero-desktop.jpg 1200w" type="image/jpeg" />
  <img src="hero-desktop.jpg" alt="Product" loading="eager" />
</picture>
WebP compresses 25-35% better than JPEG. On the jewelry brand’s site, just switching to WebP for the LCP image cut file size from 180KB to 52KB.
Step 3: Add fetch priority.
<img src="hero.webp" fetchpriority="high" loading="eager" alt="Product" />
This tells the browser: “This image matters. Download it first, even before lower-priority resources.”
I’ve tracked this exact scenario in dashboards built for consulting clients (similar to my Power BI portfolio work). The correlation between image file size and LCP is nearly perfect until you hit other bottlenecks.
Fix #4: Fix Layout Shift by Reserving Space (CLS)
CLS measures how much the page jumps around after it initially loads. The worst offender? Ads and late-loading content that pushes everything down.
The Real-World Scenario:
Page loads. User sees headline. User’s about to click. Ad loads at the top. Page shifts 200px down. User clicks on something else by accident. Frustrated.
The Fix: CSS Aspect Ratio Containers
Reserve space for content before it loads:
.video-container {
  aspect-ratio: 16 / 9;
  width: 100%;
}

.video-container img {
  width: 100%;
  height: 100%;
  object-fit: cover;
}
This reserves a 16:9 box. When the image loads, it fills the space without shifting anything. CLS stays near zero.
For ads:
.ad-space {
  min-height: 250px;
  width: 300px;
}
The ad loads into a pre-reserved slot. No shift.
I track CLS across different page templates using Looker Studio dashboards (similar to my consulting analytics work for multi-national clients). The data reveals that CLS violations spike on:
- Blog pages with ads
- Product pages with user reviews that load late
- Landing pages with floating CTAs
Each case has a different fix, but the principle is identical: reserve the space.
Fix #5: Eliminate Long Tasks and Improve INP
INP measures how quickly your page responds to user interaction. Click a button. How long before something happens?
The culprit: long JavaScript tasks that block the main thread.
The Diagnostic:
Chrome DevTools → Performance tab → Record user interaction (click a button, scroll, type). Look for red blocks labeled “Long Task.”
The Fix: Code Splitting and Debouncing
If you have a 500-line event handler running on every keystroke, break it into smaller chunks:
// Bad: blocks for 200ms
input.addEventListener('input', function(e) {
  const results = heavyCalculation(e.target.value);
  updateDOM(results);
});

// Good: yields to browser between tasks
input.addEventListener('input', function(e) {
  requestIdleCallback(() => {
    const results = heavyCalculation(e.target.value);
    updateDOM(results);
  });
});
Or use requestAnimationFrame to break work across frames:
function processInChunks(data) {
  let index = 0;
  function processChunk() {
    const chunk = data.slice(index, index + 100);
    // Process chunk
    index += 100;
    if (index < data.length) {
      requestAnimationFrame(processChunk);
    }
  }
  processChunk();
}
This keeps individual tasks under 50ms, which is Google’s threshold for good INP.
On a data analytics dashboard I built (similar to the Tableau dashboards from my portfolio), the same principle applies: if generating a chart with 10,000 data points blocks interaction, I split rendering across multiple frames. Users see progressive updates instead of a frozen interface.
Fix #6: Leverage Browser Caching and CDN (The Multiplier)
All the optimization in the world doesn’t matter if users have to re-download your assets every time they visit.
Browser Cache Headers:
Set this on your server (nginx example):
location ~* \.(jpg|jpeg|png|gif|webp|css|js)$ {
  expires 30d;
  add_header Cache-Control "public, immutable";
}

location ~* \.html$ {
  expires 1h;
  add_header Cache-Control "public, must-revalidate";
}
Static assets (images, CSS) cache for 30 days. HTML re-validates hourly. Repeat visitors see massive speed improvements.
CDN Integration:
If you’re serving users globally (especially critical for USA/Canada audience), a CDN isn’t optional—it’s essential.
I use Cloudflare for most projects. A request from Toronto to a server in Los Angeles takes ~70ms. Through Cloudflare’s Toronto node? ~5ms. That 65ms difference multiplies across dozens of requests.
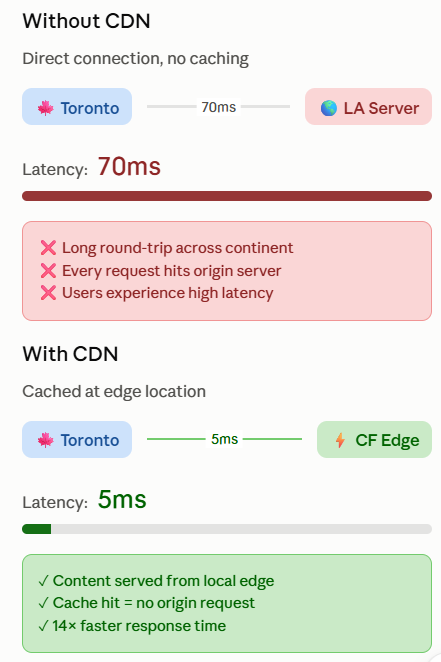
Global users benefit from edge caching—especially important for North American audiences expecting sub-100ms response times. Latency difference between direct connection and CDN-cached edge node.
Putting It Together: The Real Results
Let me show you what happened with that jewelry brand after implementing all six fixes:
| Metric | Before | After | Improvement |
|---|---|---|---|
| LCP | 4.2s | 1.1s | 73% ↓ |
| CLS | 0.35 | 0.04 | 89% ↓ |
| INP | 220ms | 52ms | 76% ↓ |
| Mobile Conversions | +0% baseline | +18% | 18% ↑ |

The conversion uplift wasn’t a coincidence. Google’s own research confirms: every 100ms improvement in page speed correlates to approximately 1% uplift in conversion rate (depending on industry). For an e-commerce site, that’s real revenue.
How to Audit Your Own Site
Here’s your action plan:
- Baseline: Run PageSpeed Insights (pagespeed.web.dev) on your homepage and top landing pages. Screenshot the results.
- Identify: Use Chrome DevTools Performance tab to record page loads and identify your specific bottleneck—LCP, CLS, or INP.
- Prioritize: Fix LCP first (usually images or JavaScript). Then tackle CLS (layout issues). Finally, optimize INP (long tasks).
- Monitor: Set up continuous monitoring using Google Analytics 4’s Web Vitals report or a tool like Looker Studio (similar to my consulting dashboards for tracking performance across multiple properties). Don’t optimize once and forget.
- Test: Use a real device, not just dev tools. Test on throttled 4G (Chrome > Performance tab > Network throttling). That’s what 60% of your users experience.
The difference between a “fast” site and a site that feels fast to real users is these details. Once you understand Core Web Vitals, you’re not guessing anymore.
References & Tools Mentioned:
- Google PageSpeed Insights: https://pagespeed.web.dev
- Chrome DevTools Performance: docs.google.com/chrome-devtools (built into Chrome browser)
- Cloudflare CDN: https://cloudflare.com
- Google Analytics 4 Web Vitals: https://support.google.com/analytics
- Google Looker Studio: https://looker.studio
