


Most people look at their bank statements once a month, scroll through a long list of transactions, and move on. Individually, each debit looks harmless: a coffee, a utility bill, a dinner out. Added up over a quarter, those small amounts can shape a household budget or a company’s cash position. The challenge is turning raw transaction rows into something a person can read in under a minute and act on.
That challenge is why I built a financial expenses analysis dashboard in Power BI. I worked with an open-source transaction dataset that includes account types, companies, categories, sub-categories, and monthly income and expense records. I used it to practice the kind of analysis I have seen finance teams need in real settings, and I want to share how the dashboard is organized and what it reveals.
Starting With the Right Questions
Before I opened Power BI, I wrote down the questions a finance reader would ask first:
- Where is the money going, by category?
- Which accounts are carrying the most debit activity?
- Are monthly outflows keeping pace with income?
- Which companies or sub-categories deserve a closer look?
In my experience, dashboards fail when they try to answer everything at once. A good financial dashboard puts the most important answers at the top and lets the reader drill down from there. I kept that principle in mind throughout the build.
The Top Row: Category Totals at a Glance
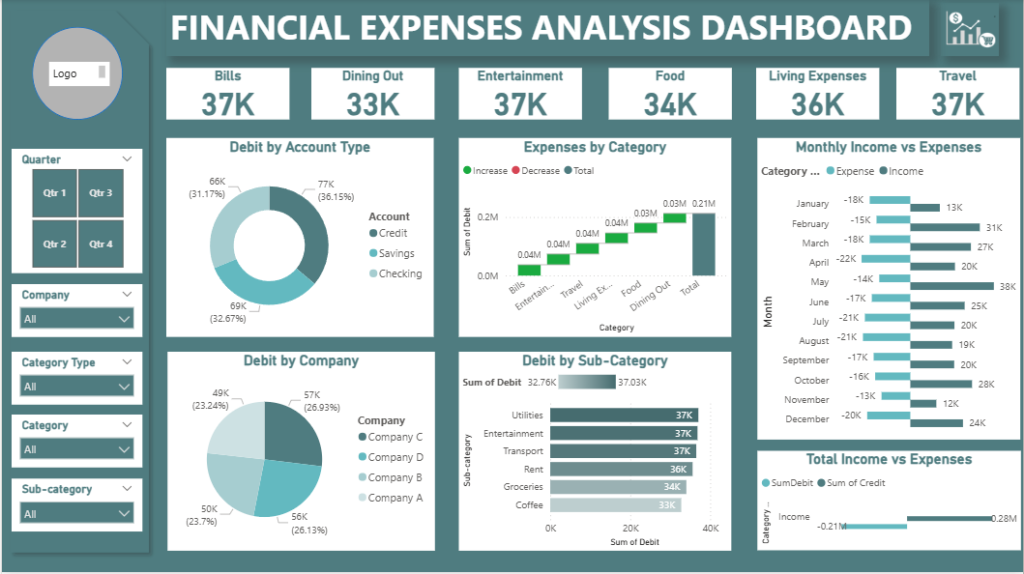
The first thing a reader sees is a row of KPI cards, one for each spending category: Bills, Dining Out, Entertainment, Food, Living Expenses, and Travel. In this dataset, each category sits at roughly 33K to 37K. That tight range is itself a finding. No single category dominates, so the spending is spread fairly evenly, and any future change in one category will be easy to spot.
KPI cards work well for this purpose because they answer the simplest question immediately. A reader does not need to interpret a chart to know that the category totals are close together.
Where the Money Sits: Account Type Analysis
The donut chart “Debit by Account Type” breaks down debit activity across Credit, Savings, and Checking accounts. Credit carries the largest share at about 77K, or roughly 36 percent. Savings follows at about 69K, and Checking at about 66K.
This view matters because the account a transaction comes from often says as much about behavior as the category it belongs to. When I review personal or small business finances, I always check whether spending is flowing through accounts that were meant to serve a different purpose. A balance split this close across three account types is worth reviewing, because it can reveal whether savings are being used for everyday spending.
Tracing the Build-Up: Expenses by Category
The waterfall chart “Expenses by Category” shows how each category adds to the total debit amount. Each bar starts where the previous one ended, so the reader can see the cumulative effect of every category. The final bar, labeled Total, reaches about 0.21M.
I find waterfall charts especially useful in finance because they make the composition of a total visible without a long table. A reader can scan from left to right and see which categories contribute the most. Bills, Entertainment, and Travel each add a substantial step, and the chart makes it easy to compare them.
Income Against Expenses, Month by Month
The “Monthly Income vs Expenses” chart is the most important view for cash flow. It places expenses on one side and income on the other for each month. Several months show income significantly above expenses, while others show the gap narrowing. December, for example, shows expenses near 20K against income near 24K.
Monthly comparisons are where many budgets quietly fail. A household or business can look healthy on an annual summary and still run short in specific months. Showing the months side by side lets a reader spot seasonal pressure before it becomes a problem.
The lower chart, “Total Income vs Expenses,” gives the overall picture. Total credits come to about 0.28M, while total expenses come to about 0.21M. The difference is the kind of number a finance team tracks closely, because it indicates how much room there is for savings, investment, or unexpected costs.
Who Are You Paying? Debit by Company
The pie chart “Debit by Company” shows how spending divides across four companies. Company C accounts for about 57K, or 27 percent, and Company D for about 56K. Company B and Company A follow with about 50K and 49K.
Vendor concentration is one of the first things I check in expense analysis. When a large share of spending goes to one or two providers, the organization should understand that dependency. It may be a sound arrangement, but it should be a deliberate one. In this dataset, the spread is fairly balanced, which suggests no single vendor dominates.
Going Deeper: Sub-Category Analysis
The horizontal bar chart “Debit by Sub-Category” ranks sub-categories by total debit. Utilities sits at the top with about 37K, followed by Entertainment and Transport at similar levels, then Rent, Groceries, and Coffee. The chart also shows a summary range of about 32.76K to 37.03K across the sub-categories.
Sub-category detail is where practical decisions start. A reader who sees Coffee at the bottom of the list might not change much. A reader who sees Utilities at the top has a clear place to begin a review. Even small line items become meaningful when they are ranked against each other.
The Filters That Make It Useful
A dashboard is only as useful as its ability to answer follow-up questions. This one includes slicers for Quarter, Company, Category Type, Category, and Sub-category. A reader can isolate a single quarter, focus on one company, or narrow down to a specific sub-category, and every chart updates to match.
Filters are where Power BI earns its place in finance work. Instead of building a separate report for each question, one well-designed model answers many of them. I built the slicers with the expectation that a reader would start broad and then narrow down, which mirrors how people actually think about their money.
What I Would Tell Any Professional Building a Similar Dashboard
From this project, I took a few lessons that apply well beyond this dataset:
- Start with the questions, not the visuals. Decide what a reader must learn in the first ten seconds.
- Keep the top row simple. KPI cards should carry the headline numbers.
- Use the right chart for the job. Waterfalls show composition, bars show ranking, and paired income and expense charts show cash flow.
- Build filters into the design. Slicers turn one report into many answers.
- Label everything clearly. Finance readers need to trust the numbers before they act on them.
Work With GlobalITConsultant.com
Building a dashboard like this is a practical exercise, but applying the same thinking to a real organization’s data takes experience with its systems, its reporting needs, and its compliance requirements. The team at GlobalITConsultant.com works with professionals and organizations to design and prepare dashboards of this kind, from expense tracking and cash flow analysis to broader business intelligence. Our data analytics services are a good starting point if you want to turn your transaction data into decisions you can act on.
